How to Mathematically Choose the Optimal Bins for Your Histogram
The article discusses the mathematical considerations for choosing optimal bins in histograms, emphasizing the importance of resolution in data visualization. It explores various mathematical approaches, including Bayesian methods and Taylor expansions, to determine how bin sizes should adjust as datasets grow. The piece highlights the balance between detail and complexity in histogram construction, aiming to improve data representation.
- ▪Histograms are essential for visualizing data density, and their resolution is crucial for accurate analysis.
- ▪The article examines how bin sizes should decrease as the amount of data increases to avoid low-resolution visualizations.
- ▪It discusses mathematical concepts such as perturbation theory and Taylor expansions as methods for determining optimal bin sizes.
Opening excerpt (first ~120 words) tap to expand
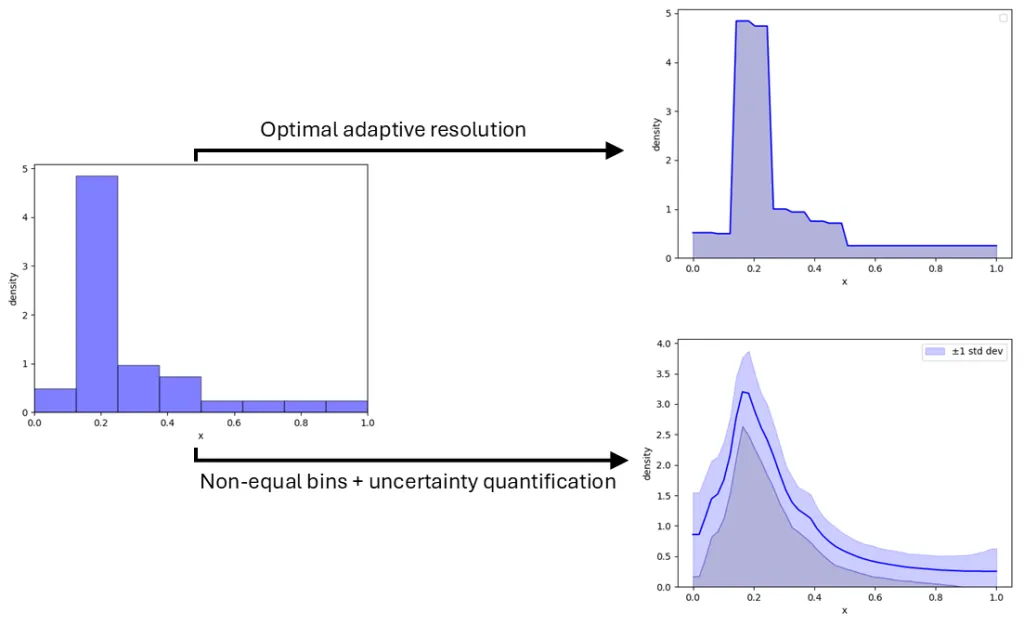
Data Science How to Mathematically Choose the Optimal Bins for Your Histogram Optimal resolution in histograms: a rigorous Bayesian approach to density fitting Fetze Pijlman May 23, 2026 10 min read Share On the left a standard density with fixed resolution, on the top right a density with adaptive resolution, on the bottom right a density with adaptive non-equal bins and including an uncertainty quantification. Abstract Have you ever wondered how to choose your bins in a histogram? Did you ever ask yourself whether there are deeper reasons for choices that go beyond that it just looks nice? While histograms are the most fundamental tool for data visualization, setting their resolution is important, especially when the histogram itself is used for further analyses.
…
Excerpt limited to ~120 words for fair-use compliance. The full article is at Towards Data Science.
Discussion
0 commentsMore from Towards Data Science