A Practical Guide to Profiling in Go
The article provides a practical guide to profiling in Go using the built-in pprof tool. It discusses the challenges developers face with profiling, including interpreting low-level data and the complexity of the tool. The guide aims to simplify the profiling process and explains various profiling types available in Go.
- ▪Go's standard library includes a profiling tool called pprof that samples the call stack.
- ▪Profiling helps identify CPU bottlenecks, memory issues, and concurrency problems.
- ▪The article explains different profiling types in Go, including CPU, memory, and goroutine profiling.
Opening excerpt (first ~120 words) tap to expand
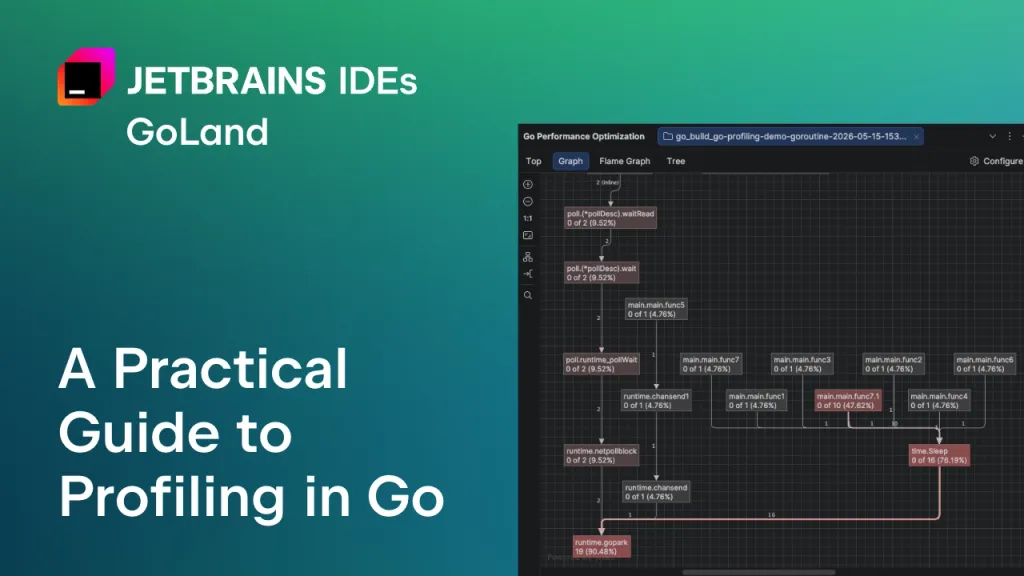
GoLand The IDE for professional development in Go Follow Follow: X X Youtube Youtube RSS RSS slack slack Download All News Releases Features Livestreams Early Access Program Tutorials GoLand A Practical Guide to Profiling in Go Dominika Stankiewicz As is often the case with Go, the standard library comes with a great tool for profiling your programs – pprof. It samples your call stack, allowing you to later generate reports that help you analyze and visualize your software’s performance without installing any plugins. Everything you need is in the Go development kit. The problem? It’s a bit of a hassle. In our discussions with Go developers, we’ve heard that some actually avoid it if they can. There could be a few reasons for this.
…
Excerpt limited to ~120 words for fair-use compliance. The full article is at The JetBrains Blog.
Discussion
0 commentsMore from The JetBrains Blog